


PrimeKey Is Not a Certificate. It Is a Health Check for the Property You Are About to Buy — or Already Own.

Updated: Oct 1
A few days ago, I shared the results of our much larger PrimeKey back test.
We took 718 Singapore new launches, reconstructed their PrimeKey grades using information available around their entry periods, and tracked their median transacted PSF to the ten-year mark.
The grade ladder held remarkably well.
I have already gone into the methodology and the headline findings in We Backtested PrimeKey Across 718 Launches. Here’s What Happened, so I won’t repeat the whole exercise here.
The short version is this:
Projects with stronger PrimeKey fundamentals tended, in aggregate, to produce stronger ten-year median PSF outcomes.
That was encouraging. But the more useful conversation starts after that finding.
Because once we accept that fundamentals matter, three questions immediately follow:
Why did they matter?
Do those fundamentals remain equally strong forever?
And perhaps most importantly:
What actually happens when we ignore them because one familiar property narrative sounds more convincing?
That is what the examples below are really about.
A PrimeKey Score Is a Snapshot, Not a Lifetime Certificate

One of the easiest mistakes to make with property analysis is to treat a good score as permanent.
Your condominium may not physically move.
The swimming pool is still there.
The MRT station is still where it was.
Your unit has not suddenly become smaller.
But the investment environment around the property is continuously changing.
This is why one of the graphics says:
“Your condo scored well in 2019. Would it today?”
PrimeKey was designed to measure eight fundamental drivers surrounding a property. But several of those drivers have a natural shelf life.
Our white paper states this very plainly:
“Scores have a shelf life.”
Take the MOP Cluster.
PrimeKey looks at the nearby HDB owners who are approaching their Minimum Occupation Period because they represent a potential future upgrader pool.
The model counts flats reaching MOP within the relevant forward window rather than treating every HDB block in the neighbourhood as permanent future demand. As time moves forward, that window moves too.
A project that once had thousands of potential upgraders arriving behind it may eventually see that wave pass.
The same applies to Government Land Sales.
An undeveloped GLS site can represent future investment, new infrastructure, a future launch and potentially a higher replacement-price benchmark.
But once that parcel has been sold, developed and occupied, it is no longer future pipeline.
It has become completed supply.
The PrimeKey white paper specifically notes that the GLS pillar has a shelf life: once the development is built and occupied, it stops being pipeline and becomes competing stock.
Then there is remaining tenure.
That one is simple arithmetic.
A 99-year property eventually crosses 90 years remaining, then 85, then 80. The physical building may have improved after an estate repainting, but the lease clock continues moving in one direction.
And finally, transformation areas themselves mature.
Buying beside years of upcoming infrastructure is different from buying after the entire transformation has already happened and the market has had years to price it in.
This is why I increasingly think owners should periodically perform a property health check, not merely buyers before purchase.
The question should not be:
“Was this a good property when I bought it?”
It should be:
“What does the next buyer see today?”
Your Exit Needs a Queue

This is one of the least glamorous parts of property investing, which is probably why it gets discussed so little.
Everybody talks about buying.
Very few people talk seriously about the mechanics of selling.
But your paper valuation is only useful if somebody is prepared to transact with you.
Consider the District 28 comparison in our backtest.
On one side was Serenity Park, a 179-unit freehold development.
On the other was High Park Residences, a 1,390-unit 99-year leasehold development.
The dramatic number was not even their eventual price appreciation.
It was transaction activity.
Our August 2026 comparison found one Serenity Park transaction over the preceding twelve months, versus roughly 60–80 annual transactions at High Park Residences.
Think about the difference.
If there is one transaction in a year, that transaction becomes enormously influential.
It becomes a reference point for sellers.
A reference point for buyers.
A comparable for valuation.
And if you urgently need to sell, there may not be another active buyer standing behind the first one.
Contrast that with a project generating transactions almost every week.
There are recent comparables.
There are listings.
There are buyers watching the development.
There is more information available for valuations.
Most importantly, there is a market.
That is why Project Size exists inside PrimeKey.
It is not simply us saying that “big condos have nicer swimming pools”.
The white paper identifies market depth and liquidity as key reasons for the pillar. More units generally produce more listings, more buyer awareness and a steadier stream of comparable transactions.
The supporting research section also references ERA Research and EdgeProp work linking boutique developments with lower transaction depth and weaker valuation progression relative to larger projects.
This does not mean every small development is bad.
A luxury buyer may deliberately pay for exclusivity. A privacy-driven buyer may specifically want fewer neighbours.
That is why PrimeKey Profiles treats those buyers differently.
But if your objective is investment and eventual resale, the question deserves to be asked:
When I want to leave, how many people are likely to be standing on the other side?
That is what I mean when I say:
Your exit needs a queue.
The Freehold Myth: When One Comfortable Story Hides Three Bigger Problems
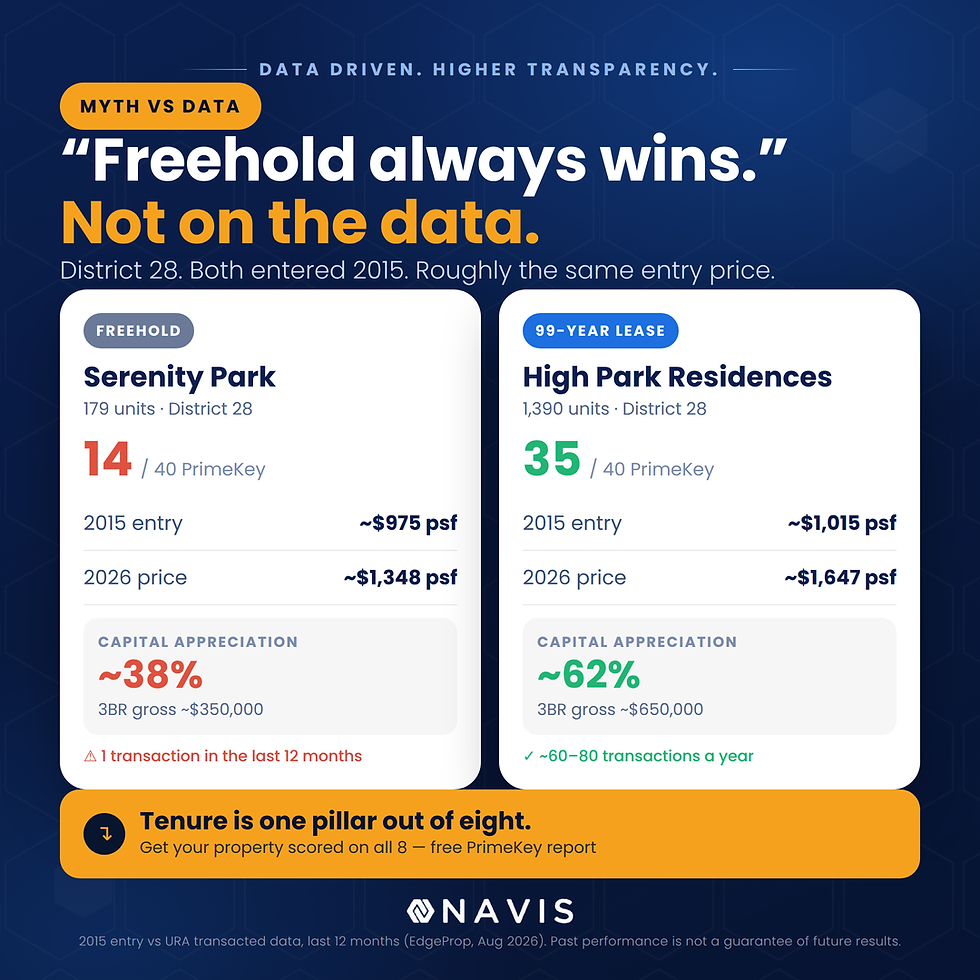
The Serenity Park versus High Park comparison becomes even more interesting because both properties were available around the same period, in the same district, at roughly similar entry PSFs.
Serenity Park was around $950–$1,000 psf.
High Park was around $980–$1,050 psf.
To many buyers, that decision would have been reduced immediately to:
Freehold versus leasehold.
And if that were the only factor that mattered, the answer would appear straightforward.
But PrimeKey forces the conversation wider.
Serenity Park retrospectively scored 14/40.
High Park Residences scored 35/40.
Importantly, the model did not say tenure was irrelevant.
Serenity Park received the maximum tenure rating.
But High Park, with roughly 94 years remaining around completion, also sat in the highest remaining-tenure band.
So the meaningful separation happened elsewhere.
1. Connectivity
Serenity Park was roughly 1.8km from the nearest rail connection.
High Park was essentially doorstep to Thanggam LRT.
PrimeKey: approximately 1/5 versus 5/5.
Our white paper's supporting research cites Knight Frank findings showing meaningful pricing benefits associated with MRT proximity.
2. Project Size and Liquidity
Serenity Park: 179 units.
High Park: 1,390 units.
PrimeKey: 2/5 versus 5/5.
And years later, that difference became visible in actual transaction activity.
3. The Exit Audience
Serenity Park had essentially no nearby MOP upgrader cluster in the framework's historical assessment.
High Park had approximately 4,511 households reaching MOP around its completion period.
That is not an abstract statistic.
Those are potential future buyers becoming eligible to monetise HDB equity and upgrade.
When the outcome was eventually measured, Serenity Park had appreciated approximately 38%, while High Park was around 62%. Estimated 3-bedroom gross profit was roughly $350,000 versus $650,000 respectively.
The takeaway is not:
“Never buy freehold.”
That would be replacing one lazy rule with another.
The lesson is:
Never allow tenure to answer an eight-factor question by itself.
A Treasure Trove: What “Oversupply” Looked Like Before the Market Had Hindsight

The second case study shows the other side of PrimeKey.
A Treasure Trove launched in Punggol in 2011 at roughly $900 psf.
If we reconstruct its score using what was knowable then, it reaches 39/40.
That number becomes much more interesting when you open up the scorecard.

It was approximately 200 metres from Punggol MRT.
Five stars.
It sat inside the Punggol 21+ transformation area.
Five stars.
It had multiple active nearby land parcels.
Five stars.
It had 882 units.
Five stars.
Fresh 99-year tenure.
Five stars.
Roughly 6,142 potential upgrader units were identified within 2km.
Five stars.
Rental yield was around 4% at launch.
Five stars.
The only pillar that did not receive full marks was School Effect.
Almost every defensive characteristic was already visible before anybody knew what prices would be in 2026.
But the GLS pillar is perhaps the most interesting.
At the time, plenty of people could reasonably have looked at all the future Punggol supply and concluded:
Oversupply. Avoid.
The PrimeKey interpretation is more nuanced.
Future supply can compete with an existing property.
But new land purchased at materially higher costs can also create future replacement-price anchors.
In the A Treasure Trove case study, new nearby land was being priced at levels implying future selling prices substantially higher than the project's roughly $900 psf entry level.
The framework therefore read part of that supply pipeline as a future pricing floor rather than simply counting new units as bad news.
This idea is also supported in the PrimeKey white paper quote by Huttons research describing how successive land releases can establish progressively higher resale benchmarks for earlier entrants.
By August 2026, A Treasure Trove's transacted average was approximately $1,616 psf, with roughly 77–80% appreciation from its original entry level and estimated gross profit exceeding $750,000 for some 3-bedroom comparisons.
But here is the part I like most about this case study.
For its first ten years, A Treasure Trove actually trailed the broader District 19 benchmark in our analysis.
Its stronger relative performance emerged later.
That is important because otherwise a 39/40 score followed by an 80% result becomes a very convenient marketing story.
Reality was messier.
Fundamentals improved the odds.
They did not give the buyer instant gratification or predicted how long a significant price appreciation would take.
And that is exactly what a fundamentals framework should look like.

Why I Think the Larger Backtest Worked
The previous article covers the actual 718-launch backtest in detail, so I will keep this part brief.
I don't think the results happened because PrimeKey somehow discovered a magical formula.
I think they happened because the eight pillars repeatedly ask a very ordinary but powerful question:
Where will future demand come from, and how easy will it be for me to exit?
Connectivity broadens your audience.
Schools create recurring family demand.
MOP clusters create upgrader demand.
Rental yield measures another form of market demand.
Scale helps create transaction liquidity.
Long tenure protects financing and the future buyer pool.
Transformation creates new reasons to enter an estate.
GLS can provide future supply but can also create newer replacement-price anchors.
The supporting research in our white paper draws on Knight Frank for MRT connectivity, Huttons for land-sales effects, ERA/EdgeProp for project size and liquidity, and NUS research covering both tenure and school-related housing premiums.
None of those ideas individually is revolutionary.
What PrimeKey does is force us to look at them together, using the same ruler, before emotion chooses the answer for us - Something that we always train our team in so that they avoid sales pitches that are overhyped and passed down and think defensively in precise terms for their clients.
That is why the white paper describes the objective as finding “safe, high-probability assets rather than high-risk speculation.”
It is defensive first.
The Most Important Limitation Is Still Price
There is one sentence from the white paper that every PrimeKey user should remember:
“Price is not an input.”
PrimeKey can tell us whether a development has attractive fundamentals.
It cannot tell us whether somebody should pay absolutely any price for it.
Nor does it see your exact unit, layout, view, floor, orientation or seller's asking price.
A great building can still become a poor investment when bought badly.
PrimeKey's job comes earlier.
Research the asset. Identify the risks. Shortlist defensively. Then deal with valuation and unit selection separately through a good agent's advice.
That boundary is intentional.
The Question I Would Ask Existing Owners Today
If you bought five, seven or ten years ago, don't only ask:
“How much has my property appreciated?”
Ask:
“Would PrimeKey still score it the same way today?”
Has the upgrader wave passed?
Has the GLS pipeline been built out?
Is the neighbourhood still transforming, or has the market already paid for the transformation?
How active are transactions?
How much tenure remains?
Is there a queue behind your exit?
A property can have been an excellent purchase in 2019 and become a very ordinary hold by 2026.
The bricks may not have changed. The fundamentals around them can.
That, to me, is the more useful lesson from all these backtests.
PrimeKey was never intended to give anyone certainty.
It was built to make the risks easier to see.
And sometimes the best investment decision is not finding the property with the most exciting story.
It is recognising the one with fewer ways to disappoint you before everybody else does.

Stuart Chng is the Managing Partner of Navis and Chief Agency District Director at Huttons and the co-creator of Navis Atlas and PrimeKey Analysis.
He adores music and can play a few instruments decently without upsetting his neighbours. When not doing so, he enjoys pillow fighting with his son and coming up with silly puns which barely amuses his wife.
Professionally, he is a licensed realtor and team leader. He is also an active investor in real estate and equities, an experienced options trader, and a developer of holiday homes in Niseko.
Stuart is a sought-after speaker and a regular columnist for property newsletters and blogs. His views have also been featured in media interviews with 938FM, Channel 8, PropertyReport, PropertyGuru, and other publications.
Throughout his career, he has helped many clients grow their wealth through selecting great real estate investments and managing their portfolios actively. Read his clients' reviews here.
Stuart has also coached many top million dollar producing agents from top Singapore real estate agencies. Read his agents' reviews here.



Comments